A significant percentage of traders/investor in the stock market does not read financial statements. Find out how the 3 financial statements are linked and it automatically gains you an advantage over other investors.
What are financial statements?
Every company, public or private, is obliged to do accounting. The statements are records that tell the story of the company in numbers. These are a simplified representation of the company and are thus imperfect and incomplete. You will find here where the money came from, where it went to, and where it is now. In short, you will find the financial health of the company.
Public companies do have other accounting policies than private ones. The size of the business, location, and other factors influence the different accounting policies. All those rules depend on the laws of the country where the business’ headquarters are located.
American public companies have to follow the GAAP accounting standards. Whereas in Europe the accounting standards of the IFRS are followed. More than 160 countries follow the IFRS standard as of June 2023.
We, as value investors, are mostly interested in public companies and will limit the article to this category of businesses. Public companies are obliged to update the shareholders frequently. Every quarter, they will bring out the unaudited financial statements. These are named the 10-Q in America. Once every year, an audited version comes out, the 10-K. In Europe, the financial state of the company is reported at least every 6 months.
3 Key financial statements
Public companies do have many rules to follow and report on many items. This results in documents with often hundreds of pages. It contains an overview of the business, risks, 3 key financial statements, notes from managers, and more. Although all information in there can be of importance, looking at 3 of the 5 financial statements initially helps you significantly.
Knowing the business is helpful at the start too, but let’s assume you already know what the business is about. After all, you decided to read statements of this specific company.
The 5 statements following the GAAP accounting standards are:
Consolidated balance sheet
Consolidated statements of operations and comprehensive income
Consolidated statements of cash flow
Consolidated statements of stockholders’ equity
Notes to consolidated financial statements
The 3 key statements we will look at, are the first three on the list. Otherwise known as balance sheet, cash flow statement, and income statement. It is preferred to read them in this order. The balance contains the wealth accumulation of the company from inception.
The European accounting standards from the IFRS have the same statements. It is named slightly differently (following the same order):
Statement of financial position
Statement of profit or loss and other comprehensive income
Statement of cash flows
Statement of changes in equity
Notes
Note
In this article, we use the vocabulary from the GAAP standard to keep clear and organized. Most of the investors will presumably look for American companies since this is the most mature stock market. Later, we also have an example following the IFRS method and use the corresponding terms.
The 3 key financial statements contain most of the interesting figures to look for. Investors always want to know the following: types of assets, liabilities on assets, value of assets, generation of cash & profits (earnings/income).
Going over the quarterly or yearly reports is a bit more complicated than this. There is more to it and how to interpret the figures when analyzing a company. This is unfortunately out of the scope of this article.
Many investors start by taking a look at the income statement when they analyze a company. They look for increasing quarterly profits. But only looking at increasing profits is not a preferred method. The board of directors and the CEO can decide to inflate the numbers in the income statement to look better on paper than it is.
The balance sheet is already harder to manipulate. Although it is possible to value assets higher. This increases the stockholders’ equity. The cash flow is the most honest report and here you can check the net income of the company.
Balance sheet
The balance sheet contains all the wealth accumulation since inception. This statement has two sides, called the assets and the liabilities. The assets represent the use of capital to generate income. While the liabilities represent the sources of capital raised from lenders and investors. The equation below states that both sides of the balance sheet are always equal.
Assets = Liabilities = Debt + Equity
Where:
Debt: is external capital.
Equity: is internal capital attributed to investors or owners.

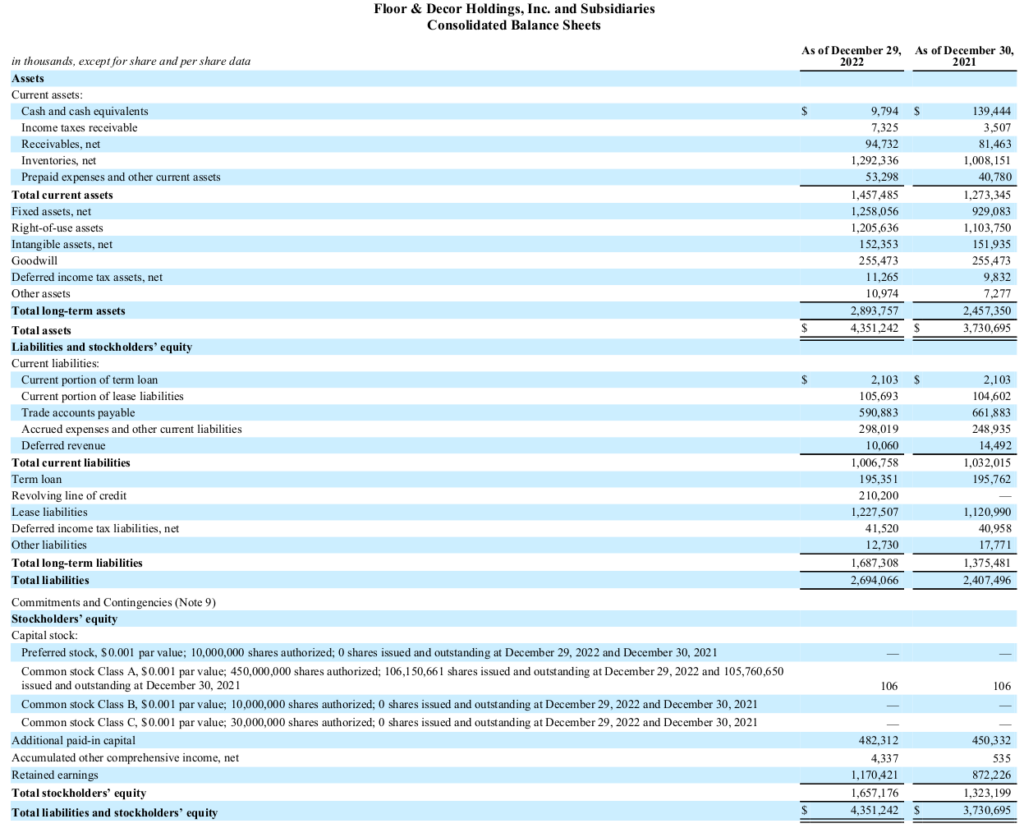
The image above is the balance sheet of Floor & Decor Holdings (FND) from the 10-K report for the financial year 2022. It reads from top to bottom, starting with the listed assets. Followed by the liabilities and stockholders’ equity of Floor & Decor Holdings.
The sheet follows a certain order. The assets are ordered according to the liquidity, from high to low. And the liabilities are ordered to the priority of payback, from first to last.
Note
The IFRS has a different order of the balance sheet. There the most illiquid assets, intangible resources, are listed first and last the most liquid assets, cash & equivalents. On the liabilities side, stockholders’ equity is listed first, followed by long-term debt and then short-term debt. Note that the IFRS is in reverse order to the GAAP.
The assets category is divided into the current assets and the long-term assets, also called non-current assets. The current assets contain cash & equivalents, receivables, the inventory among others. The long-term assets are fixed assets, intangible assets, goodwill, and other assets. Fixed assets are also known as plant, property & equipment (PP&E).
The liabilities have current liabilities and long-term liabilities. Current liabilities include short-term debt, current lease obligations, and unpaid bills to third parties. Long-term liabilities contain long-term debt, tax obligations, and lease terms.
Short-term debt is a debt due within 12 months, whereas long-term debt is debt or loans due later than 12 months.
The stockholders’ equity is the capital left for shareholders after subtracting the debt (liabilities) from the assets. This is also known as the book value. Assets are not always properly evaluated, which can influence the book value.
When the company files for bankruptcy, the assets have to be sold. The selling price is more often than not under the valuation on the balance sheet. This leaves less for the shareholders.
The equity shows the figure, retained earnings. This is the accumulation of all the profits and losses over the lifetime of the company.
Cash flow statement
The cash flow statement reports a summary of all the cash going in and out of the company. Unlike the balance sheet, it only provides information on a specific period. For example, the quarterly reports the cash in and outflow of the company over 3 months. The statement provides a clearer picture of the company’s ability to pay debt or loans. Also, the financial growth of the company is for investors better to grasp.
The structure of this statement includes 3 components:
Cash flow from operating activities
Cash flow from investing activities
Cash flow from financing activities
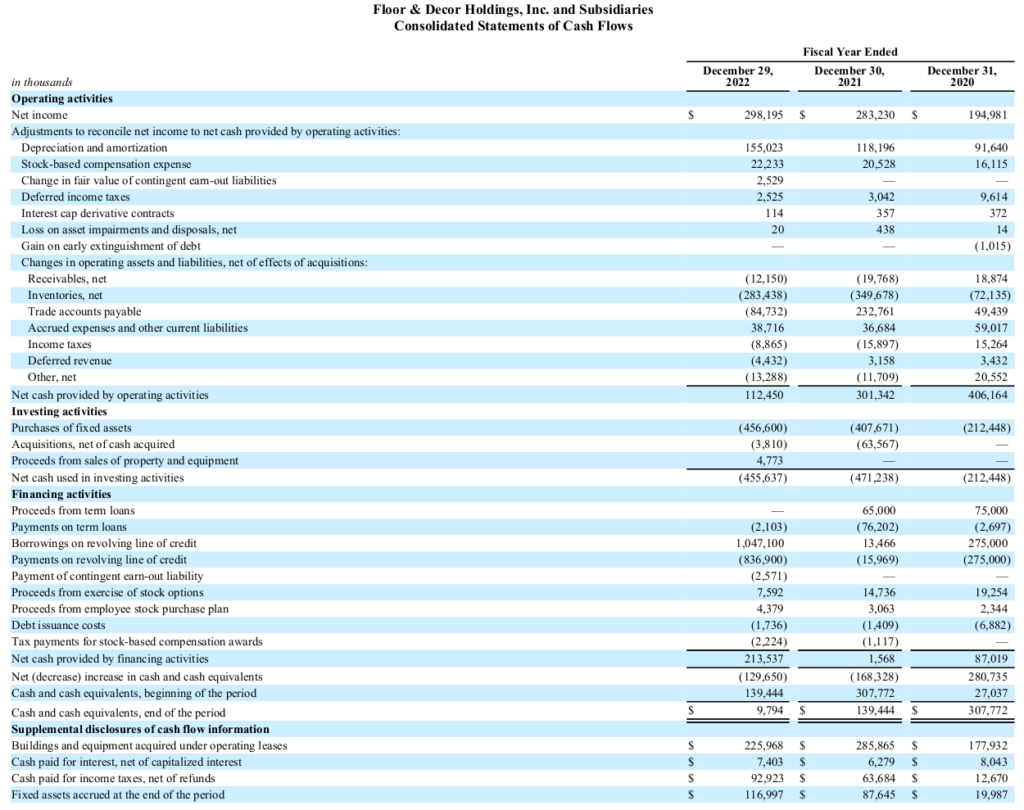
Cash from operating activities reflects how much cash is generated from the products and services sold by the company. Not only sources of cash are included, but also the uses of cash to generate income are added. Examples are sales, income from interest, rent payments, and salary of employees. What exactly is included in the operating activities is dependent on the type of business. The figure below is shown that the deprecation and amortization of Floor & Decor Holdings is a big part of the operating activities.

Cash from investing activities includes any cash and sources of cash used to invest in the company. These investments are meant to grow the company further. Merging or acquisitions, purchases/sales of assets, and purchases of PPE are all part of the investing activities of Floor and Decor Holdings.
Cash from financing activities captures capital raising and repayments of debt. Raising capital can be done by issuing debt or equity, cash from loans, or proceeds from issuing shares. The outflow of cash is subject to paying dividends, stock buybacks, and debt repayments.
At the bottom of the statement is the net change of cash & equivalents reported. Some companies report the free cash flow of the company too. But often, investors find themselves calculating this metric. This is the sum of the 3 components. The formula is as follows:
net\>change\>cash\>\And\>eq\>=\>cash\>flow\>from\>operating\>activities\>+\>cash\>flow\>from\>investing\>activities\>+\>cash\>flow\>from\>financing\>activities
>> Learn more: levered and unlevered free cash flow
Income statement
The income statement provides insight into the company’s revenue, expenses, profits, and losses during a specific period. It is the flow of wealth into and out of the company.
Above is the income statement of Floor & Decor Holdings show. It follows the typical structure:
Revenue: also known as net sales, is the cash inflow from the company’s primary business activities, such as sales of goods and services.
Cost of goods sold (COGS): these are the direct costs of producing or delivering the product. This includes costs like raw materials, salary, and transport.
Gross profit: the difference between the revenue and the cost of goods sold. Gross profit is an indication of the profitability of the company’s core operations. Investors like to compare this figure with the competitors to see how efficient the company is in producing goods/services relative to its competitors. For comparison, investors express this figure in percentages.
Operating expenses: this includes various expenses for operating the business like research and development costs (R&D); marketing; selling, general & administrative (SG&A), and others.
Other income & expenses: this is income not attributed to the core business. Interest income and proceeds from the sale of assets are typically included in this section.
Income taxes: it is the tax payable over the income of the company.
Net income: also known as profit or earnings. It is the final figure on the income statement. Subtracting the total expenses, including taxes, from revenue results in profit.
revenue\>–\>cost\>of\>goods\>sold\>=\>gross\>profit\>-\>operating\>expense\>=\>operating\>income\>–\>other\>operating\>expenses\>=\>income\>before\>tax\>-\>income\>tax\>=\>net\>income
On the income statement is also the earnings per share (EPS) figure reported. It is a figure that is often looked up before anything else. The basic EPS is the net income divided by the total shares outstanding. There is also the diluted EPS. It is divided by the total outstanding shares plus shares added in the future. Adding future shares is done through stock options or convertible bonds for example. The diluted EPS is sometimes equal to the basic EPS, but often lower.
>> Learn more: What is a statement of operations?
How are the 3 financial statements linked
The 3 statements are all linked with each other and form a circle. Together the statements provide a comprehensive overview of the company’s operations. Since there are two widely used accounting principles, both the GAAP and IFRS are shown with examples.
GAAP example
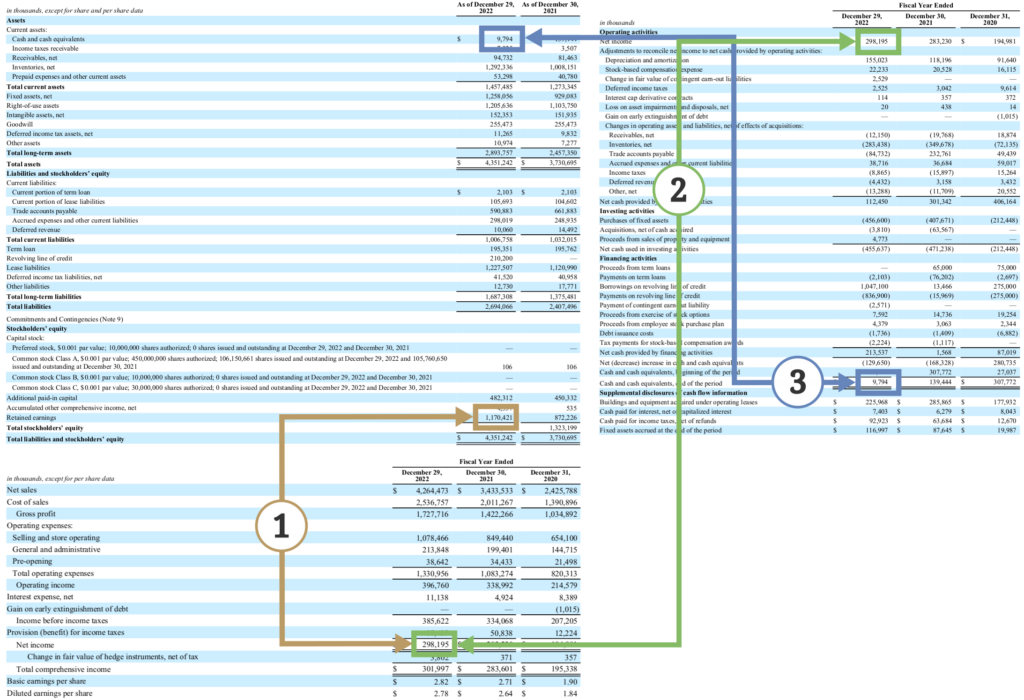
In the figure below are the 3 financial statements of Floor & Decor Holdings shown. The top left is the balance sheet and underneath is the income statement. The cash flow statement is on the right side of the figure. Every link is color-coded and labeled with a number.

The link between the balance sheet and the income statement is labeled with the number 1. The net income is added to or subtracted, when it is a loss, from the retained earnings in the stockholders’ equity. Retained earnings are the cumulative sum of all the net income of the company minus the dividends paid out.
RE = RE_{begin\>period} + NI – D_{cash} – D_{stock}
where:
RE = retained earnings at the end of the period
RE_{begin\>period} = retained earnings at the beginning of the period
NI = net income
D_{cash} = cash dividends
D_{stock} = stock dividends
The net income is also connected with the cash flow statement, see label number 2. The net income is the bottom line for the income statement and the top line of the cash flow statement in the operating activities section. Net income is here adjusted to the real cash brought into the company. This is done by subtracting non-cash expenses such as deprecation & amortization and the change in net working capital.
The cash flow statement tracks the changes in the balance sheet’s working capital, which is the current assets and liabilities. When the net working capital increases, there is an outflow of cash. More capital is tied to operations. The other way is a decrease in net working capital. Cash comes in through collecting more payments from customers.
Purchases of PP&E, raising capital, deprecation expenses, and other non-cash expenses have an influence on the cash balance at the end of the period. This figure is found at the bottom of the cash flow statement. The link between the balance sheet and the cash flow statement is labeled with number 3.
IFRS example
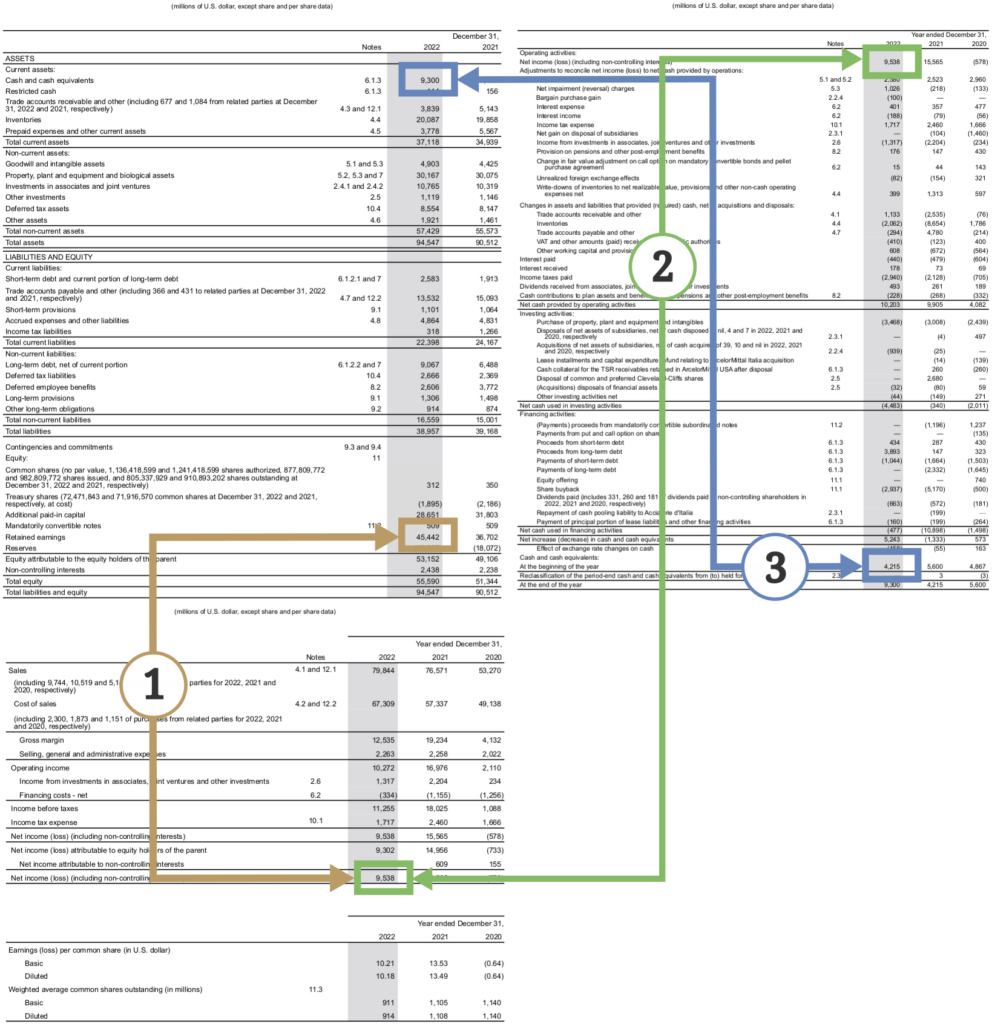
Since there are multiple accounting standards, we show you also an example with the IFRS standard. Although, there is not a significant difference. The linking of the 3 financial statements is the same. The colors and labeling match the GAAP example.

The statements of ArcelorMittal (MT) are shown in the figure above. ArcelorMittal is the second largest steel manufacturer and is headquartered in Luxembourg.
In the left top corner is the statement of financial positions placed. Below that is the statement of profit or loss, which MT calls the statement of operations. And on the right is the statement of cash flows. Remember that the names are different as the IFRS requires.
Earlier in the article was stated that the statements of financial positions have a reversed order to the GAAP’s balance sheet. The illiquid or intangible assets are at the top and then less liquid assets and followed by liquid assets (i.e. cash & equivalents). Note that in this example the order is according to the GAAP.
When you look often through statements with the IFRS standards, you will notice that the order is sometimes reversed and sometimes not. Also, the names of the statements do often not match. A mixture of GAAP and IFRS lingo is often seen. In the end, it is not significant. When you get comfortable with reading the statements, you will not be thrown off by them. Practice often!
Frequently Asked Questions (FAQ)
Where to find the financial statements?
There are several ways to retrieve financial statements. The first method is through the site of public companies. They put the financial statements on their website under the category ‘Investor Relations’. A common practice is to go to your favorite search engine and type: <company name> + investor relations. The correct page is shown in the search results. Go to this page and here you can download the files often in different formats, including PDF.
Another way is to go EDGAR from the SEC. EDGAR is the database with all the public company filings. Unfortunately, the documents here are not in PDF format and can not be saved. My personal format goes out to PDF over the other files EDGAR offers.
In Europe, there is no similar database like EDGAR. For European companies, you have to download the information from their investor relations page. The European Economic and Social Committee has adopted the European Single Access Point (ESAP), which should be close to what EDGAR is. It is not clear when ESAP will be operational.
How to read the financial statements?
First of all, you need to understand the accounting standards used in the financial statements. This is always shown in the report. This is an important step because you need to know what the numbers mean and how they are interpreted.
A common order to read the statements is starting with the income statement followed by the cash flow statement and balance sheet. It makes more sense to read them reversed. Start with the balance sheet, cash flow statement, and then the income statement.
Use a vertical approach first and then a horizontal approach to the balance sheet. Use then the cash flow statement to understand how money flows within the company. Last, take a look a the income statement.
The notes from management help you to shed light on management decisions and abnormalities in the 3 financial statements.
Do you want to fully understand the business? Read then also the risks within the company and the industry.
There is a lot more to read in the statements and what to look out for, what can not be covered here as a condensed answer.
What is GAAP?
GAAP stands for General Accepted Accounting Principles. It is a set of standards, principles, and procedures to guide the preparation of financial statements. Public companies in America have to follow the GAAP standards.
What is IFRS?
IFRS is a standard for accounting principles for more than 160 counties (June 2023). IFRS stands for International Financial Reporting Standard and has the same purpose as GAAP. The design provides a globally consistent framework for accounting principles.
