
The statement of operations is the most used statement for fundamental analysis. Find out here what the statement of operations is and how it is prepared. Understand the limits to maximize your fundamental analysis.
What is a statement of operations?
The statement of operations shows a company’s revenue and expenditures during a past period. Most investors know the statement of operations as the income statement, also known under other names, like the statement of profits & losses or the statement of earnings. It is one of the three primary financial statements alongside the balance sheet and the cash flow statement. It aims to show shareholders and the company’s managers the gained profits or incurred losses during a month, quarter, or year.
The statement of operations is prepared by one of the two methods, the single-step or the multiple-step method. The single-step method subtracts expenses from the total revenue to find the net income (bottom line). As the method suggests, the multiple-step method uses more steps to find the company’s net income. First, it calculates the gross profit, followed by the operating expenses. It is common for public companies to use the second method. Later in the article, we will discuss a real example of this.
The difference between a statement of operations and an income statement
The main difference is the semantics. Investors may know the income statement under several names, and the statement of operations is one of them. Both report the net income of the company. However, the reporting format may slightly differ, but the net income is the same result. The different terms and statement structures come from the accounting methods like the GAAP and IFRS.
Uses of the statement of operations
Typically, the press, Wall Street, and analysts discuss the earnings per share (EPS), beating estimates, and forecasts of the next quarter’s earnings. These discussions in the media and research reports make the income statement popular with investors. The focus is often on profitability alone, which is not a proper assessment of the company’s financial health.
Another way of looking at profitability is the gross profit margin figure. Subtract the cost of goods sold (COGS) from the revenue or net sales to find the gross profit figure. Then, divide the gross profit by the revenue/net sales, which results in the gross profit margin. This figure makes comparisons between companies within the same industry possible.
You can similarly retrieve the operating margin as the gross profit margin. Divide the operating income by the revenue to arrive at the operating margin. It tells you how much the company earns on a dollar of sales before interest and taxes. Again, you can compare this figure between similar companies within the industry.
The statement of operations and its management notes give insight into a company’s several revenue streams. These are divided into operational and non-operational ones. Operating revenue is proceeds from goods and services. In contrast, non-operational income is a one-time income for the company. This income comes from investment activities, such as bonds (marketable securities). The cash flow statement provides more information on non-operational income under ‘cash flow from investing activities’.
>> Learn more: levered and unlevered free cash flow
Items in the statement of operations
The multi-step method of the statement of operations has multiple items to provide shareholders and managers with more insights into the company’s profitability. Every company may use its terminology for the items. However, the terms are similar, and you will pick it up more quickly with practice. For now, we discuss the most common terms in the statement.
Revenue or net sales is the revenue from goods and services sales for the past period. Companies with both goods and services tend to break down the total figure in sales from goods and sales from its services. Our research shows that investors value growth and price stocks accordingly.
Costs of goods sold (COGS) or cost of sales is the direct production costs before selling the products or services. The direct costs include materials, labor, and parts. Shipping costs and marketing are excluded from here.
Gross profit is the revenue minus the COGS. From here, you can calculate the gross profit margin. The margin figure makes comparison between companies in the same sector possible. The higher the margin, the better.
Selling, General & Administrative expenses (SG&A) indicates the indirect costs of operating the company. Selling is the cost of marketing, promotion, and advertising. General & Administration expenses include rent for office space, salaries, travel costs, insurance, office expenditures, and more. Most companies have Deprecation & Amortization (D&A) in SG&A; some mention D&A separately.
Research and Development (R&D) is another operating expense. Companies that invent or improve new products or services have these expenses.
Operating income is the earnings from regular business operations. It is the gross income before non-regular income, and expenses, interest, and taxes are subtracted from the revenue. EBIT is a widely-used abbreviation and stands for earnings before interest and taxes. Technically, EBIT includes other operating expenses but is often used as a synonym for operating income.
Note
Investors sometimes misuse EBIT and assume its figure for the business’s cash flow. Unfortunately, cash flow can’t be captured in one figure. One has to dive into the cash flow statement to understand a company’s actual cash flow.
Interest is an item that is income or an expense. The cash of a company may get interest from a bank. When the company has a debt, then it has interest expenses. A company may break up interest into two lines for investors to see the difference.
What other income or expenses are, is dependent on the industry. It may include impairment charges, foreign exchange impacts, gains/losses from investment sales, or stock-based compensation.
Income taxes are taxes a company has to pay over pre-tax income. These are current tax liabilities and are paid for the current year.
Net income or bottom line is the gains/losses of the company. The net income adds to the retained earnings on the balance sheet. The two figures link the two statements together.
The company often calculates earnings per share for investors. It is a commonly used figure, and out of convenience, it is added but has no influence on the other figures on the statement of operations. Some companies choose to add the outstanding shares used for the earnings-per-share calculations. The stronger the growth in yearly EPS, the higher the Price/Earnings of a company, as found in our research.
Limitations of the statement of operations
The statement of operations is prepared after the financial data is in. It leaves room for managers who want to improve the business’s net income. Managers create accounting policies within the company. Companies frequently change their policies in favor of the net income increase. Shareholders love the increasing earnings per share. Some managers attempt to serve shareholders with an ever-increasing EPS, which creates short-term benefits rather than long-term ones.
Investors should instead look at the cash flow statement when analyzing the company’s health. The statement of operations is the manager’s opinion on profit, while cash is real.
Note
Net income is not equal to cash flow. A company may appear profitable but doesn’t generate sufficient cash flow, and vice versa.
Another limitation is that the income statement doesn’t provide actual costs. Assets may be longer in service than expected. Still, the costs are deprecated on the income statement over a few accounting periods. Note here that assets don’t deprecate over their actual usage lifetime. It only gives a cost estimation on the statement.
A real example with Apple Inc.
Look at Apple’s (AAPL) statement of operations for Q3 from FY2023. Starting at the top, we see it’s unaudited, meaning no independent accountancy firm guarantees the figures in the earnings report. Also, it is essential to note the figures are in millions, except for the number of shares.
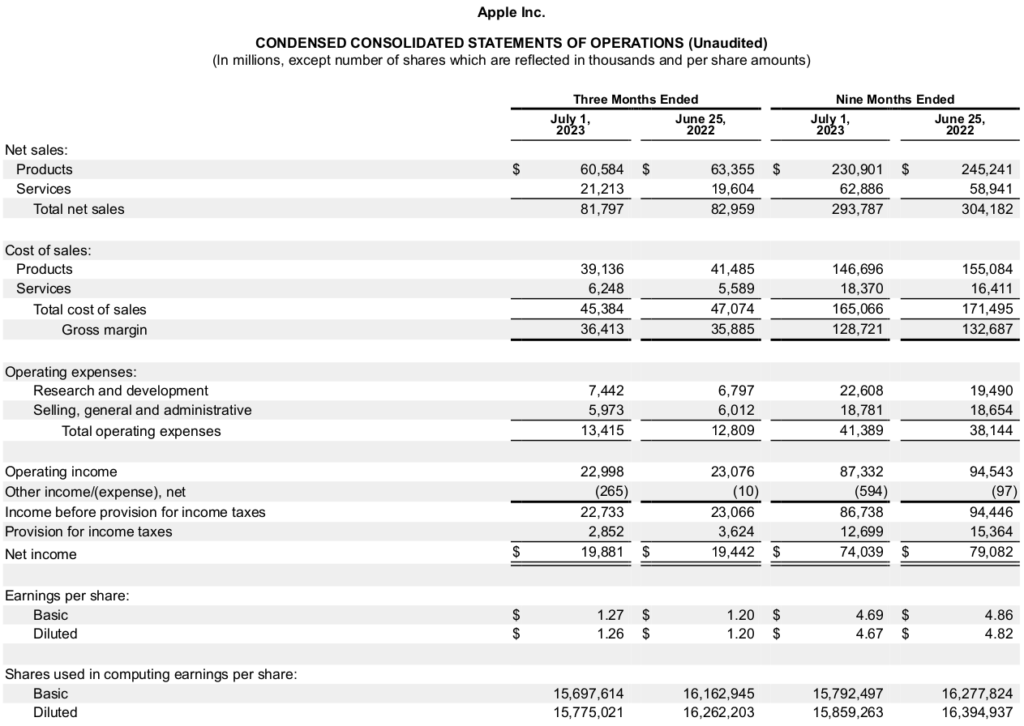
The top line is the revenue divided into products and services. It follows with the cost of sales. A company with only products often calls it the cost of goods sold instead. When you subtract it from the net of sales, it results in the gross profit, or gross margin, as it is called here. The gross profit margin for Apple this quarter is 44.5%.
The research & development and selling, general & administration are grouped under operating expenses. Apple keeps the statement minimalistic. Other companies may add deprecation & amortization or split up SG&A. Subtracting the total expenses results in operating income.
Apple chooses to combine other income and expenses. Further in the earnings report, the company breaks this figure down for investors. Combining the other income and expenses prevents cluttering the statement of operations.
The provision for income taxes is calculated over the operating expenses minus the other income/expenses. Subtracting the taxes over income finds us the net income.
The formula for preparing the statement of operations is as follows:
revenue\>–\>cost\>of\>goods\>sold\>=\>gross\>profit\>-\>operating\>expense\>=\>operating\>income\>–\>other\>operating\>expenses\>=\>income\>before\>tax\>-\>income\>tax\>=\>net\>income
Another way to show the preparation of the statement is through a Sankey diagram. On the left side, the green flows represent the revenue of Apple’s third quarter. The cost of sales, in gold, is directly tied to the expenditures for creating the products and services. Follow the blue flow results in the net income at the top right corner. At every step, one or more expenditures, in rust color, are subtracted.

The statement of operations should be equal on this diagram’s left and right sides. When you sum up the products and services, it results in $81,797. And the sum of net income, other expenses, income taxes, SG&A, R&D, and cost of sales equals $81,797.
Apple provides the basic and diluted EPS below the net income. It is purely at the convenience of investors as the P/E ratio is the most looked-for figure in the financial world. They also provided the number of shares used for the EPS calculation.
