
We analyzed 8918 public companies from 40 countries worldwide to better understand why some stocks are cheap or expensive compared to others on the stock market. Specifically, we looked at the correlation between the Price/Earnings (P/E) ratio and metrics such as revenue, dividend, net debt, profit/losses, etc.
Key findings
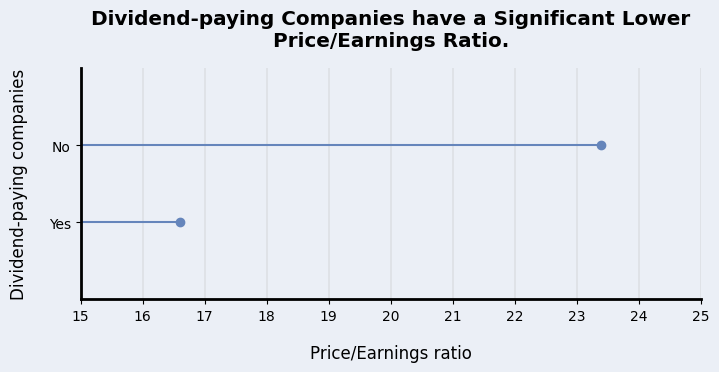
The 1816 nondividend-paying companies have a P/E ratio of 23.4, as opposed to 16.6 for the other 7102 companies with a dividend payout.
Despite many companies purchasing their shares, the net buybacks are not valued higher than those that do not.
Companies with 10 years of consecutive years of revenue growth have a higher P/E at 23 than those with fewer years of growth.
The higher the gross profit margin, the higher the P/E multiple.
3673 companies have no net debt. With a 19.8 P/E multiple, it is valued a couple of times more than a P/E of 15.9 for companies with a net debt.
The estimated earnings-per-share growth shows a distinct difference between growth and decline expectations.
The Mega-cap is 10 points higher valued based on earnings than the Large, Mid, and Small-cap. The latter contains the most potential cheap stocks.
Download the dataset
Methodology
To answer the research question, we needed a dataset with many figures to test for potential correlations. First, we created six categories: growth, dividends, share buyback, profitability, financials, and estimated growth. Within each group, key figures were selected. For example, the category growth contains revenue, earnings per share, etc.
Second, we selected 8918 companies from 40 different countries. The following conditions are used to filter the total public companies available:
The 40 countries with the highest GDP using estimates by the IMF for 2023.
The market capitalization of each company is equal to or higher than $300 million. Thus, companies from the Small-cap and larger.
The price-to-earnings ratio is between 0 and 100.
The company’s annual report has been publically available from 2013 onward.
ETFs, mutual funds, and trusts are excluded.
Note
The number of selected companies may vary because of changes in a company’s stock price. It influences the market cap and P/E ratio. Thus, consider the data a snapshot of market conditions ending financial year 2022.
Third, we used the TIKR stock screener to retrieve the data. It needed data cleaning using Python programming language. Renaming columns and changing data formats, among others. It tells you the included companies and all examined figures.
Fourth, we analyzed the data and tried to answer the research question. Analyzing data may be tricky. A correlation between two groups of data often happens. But this may be an inaccurate observation. We test for the likeliness of valid observations (statistical significance) to eliminate the wrong analysis. The valid observations are presented here as our findings, and we discarded the wrong ones.
Note
We used the median Price/earnings instead of the average P/E. Many more companies have a P/E ranging from 0 to 30 than 30 to 100 (unequal distribution); thus, it requires median calculations. The average is needed when companies’ P/E ratios are spread evenly from 0 to 100.
Dividends
Companies have several ways of returning capital to their shareholders. Paying dividends is considered the most direct form of returning cash. The majority (80%) of the researched companies pay dividends. Only 20%, equal to 1816 companies, did not do so in 2022.

Dividend-paying companies have a significantly lower P/E ratio of 16.6, as opposed to 23.4 for non-paying ones. A considerable gap raises the question of how such a difference occurs.
Various reasons may cause the Price/Earnings multiple differences. Studying every individual company is necessary to know it precisely. This goes beyond the scope of the study. However, by understanding a business’s life cycle and taxation, one can understand the occurrence of the P/E ratio gap.
First, a company’s life cycle consists of four phases: launch, growth, maturity, and decline. During the launch and growth phases, the company needs cash to create a product or service, advertise, and gain market share. These activities require a lot of money. Companies invest the profits back into the company’s growth. As a result, there is no money left to pay dividends. The possibility of future growth creates expectations among investors that result in higher P/E multiples, thus expensive stocks.
It becomes different during the maturity and decline phases of the company. Excessive capital is redistributed to shareholders. Businesses in this part of the cycle have little room to grow, or the market is saturated. Usually, the P/E ratio is lower because of lower future expectations. As a result, it may be a cheap stock.
Second, dividends are taxed in many countries. Companies pay taxes over the capital they want to distribute, and the receiver often pays a tax on top of it.
Takeaway: investors value non-dividend-paying companies over dividend-paying ones. It is likely that the 20% non-dividend-paying companies are primarily in the growth phase and put the capital better to use than returning it to their shareholders.
Share buybacks
A share buyback program is a second way to return capital to shareholders. It has become a popular method for public companies in recent decades. Dividends are more frequently taxed, whereas share buybacks are lightly taxed or not at all.

Approximately 33% (less than 3,000 companies) have a net share buyback program. Research concludes that this percentage does not change over the past 1, 3, 5, or 10 years.
There are more companies with a buyback program than only the 33%. But the total shares outstanding of those companies do not go down. Directors and CEOs are granted stock options based on managing performance, which causes share increases. Another reason is creating shares for acquisitions, mergers, or investments.
The share-creating policy costs the business capital when the company’s intrinsic value is lower than what is paid for on the stock market. For this reason, we decided to look at each company’s net decrease in outstanding shares.
Takeaway: We looked for decreases over long and short periods up to the last ten years. No matter the timeframe, there is no significance between the reduction of outstanding shares and the P/E ratio.
Growth
The third way for companies to return capital is through investments for the company’s growth. It is an indirect way because it takes considerable time before it is reflected in the share price.
Investors may define growth within a company in various ways. In this study, we limit ourselves to the figures on the income statement. We looked at the revenue, gross profit, operating income, net income, and earnings per share. For each figure, the consecutive years of increase are looked at.
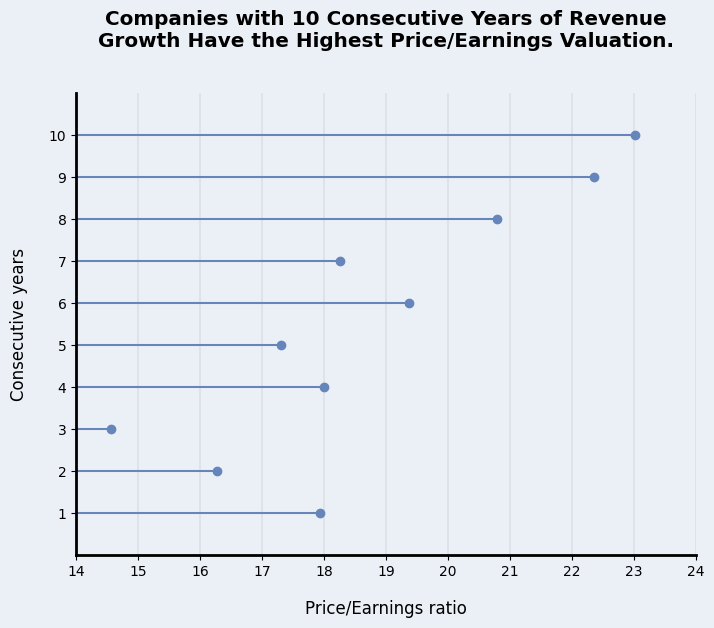
The higher consecutive revenue growth showed the best correlation with higher price-to-earnings multiples. The following figures down the income statement, such as gross profit and operating income, showed less correlation.
Investors value only the revenue, but why? The income statement is more an opinion on profits by accountants. To an extent, they can manipulate the figures, except for the sales/revenue. It may be why investors prefer to look at sales over the other figures.
An exception is the earnings-per-share (EPS). It follows the same pattern as revenue. It makes sense as many investors look at the EPS and P/E ratio. Great investors in the past, like Peter Lynch, have tried to simplify investing for the majority. The earnings-per-share played a big part in his analysis.
It is interesting to note that the EPS and net income do not show the same pattern. Share buyback programs could explain it.
Takeaway: Investors value yearly consecutive revenue, and EPS increases over other income statement figures.
Profitability
A company’s profitability has multiple definitions. Investors may look at net income, cash flows, or ratios. We looked at figures as if we owned the business. The analysis includes return on assets (ROA), return on capital (ROIC), gross profit margin, and unlevered free cash flow. To our surprise, the ROA and ROIC had no significance.
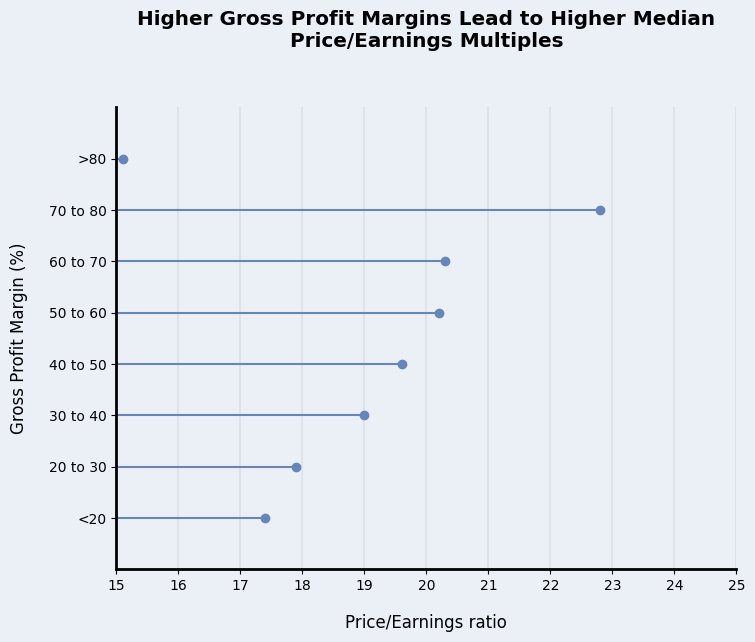
The gross profit margin percentage in 2022 shows an interesting pattern. The higher the gross profit margin, the higher the P/E ratio. It changed above 80%, but why?
| Sector | Number of Companies |
P/E ratio |
|---|---|---|
| Communication Services | 34 | 22 |
| Consumer Discretionary | 31 | 19.7 |
| Consumer Staples | 11 | 27.8 |
| Energy |
44 | 7.5 |
| Financials | 752 | 8.8 |
| Healthcare | 43 | 29.6 |
| Industrials | 33 | 18.9 |
| Information Technology | 26 | 49 |
| Materials | 18 | 14.2 |
| Real Estate | 9 | 8 |
| Utilities | 20 | 15 |
The table displays every sector and number of companies with a gross profit margin above 80% in 2022. What we see is that the financial sector is heavily represented. The financial sector’s P/E is 8.7. It results in a lower average ratio for companies with >80% gross profit margin.
Unlevered free cash flow (UFCF) is the cash that is left after all business operations. It is all the capital that the company can return to shareholders without jeopardizing the business. We looked at the UFCF margin for potential correlation. After all, it is an indication of the ability of the distribution of capital.
An interesting pattern emerged. Negative UFCF margins have higher P/E ratios. Around 0% and above 20% valuations are lower, while companies with margins between 10% and 15% have higher P/E multiples. The high-valued companies with a negative margin are likely in the growth stage. While companies with 10 to 15 percent margins are possibly in the maturity phase.
We expected that the higher the margin, the higher the P/E ratio. We dug into the group of companies with >20% margins and learned that the financial sector is the majority (again), pushing the median ratio down.
Takeaway: Investors will pay more for higher gross profit margins. They also prefer companies in the growth and maturity phase regarding unlevered free cash flow.
Financials
We assume that the company’s financial health is essential to the investor. Thus, we looked at ratios and figures, such as quick ratio, total debt/equity, retained earnings, and net debt. Only the net debt showed a significant difference in valuation.

Research shows that 59% of the companies had a net debt in 2022, which accounts for 5245 companies. The net debt is the total debt minus the total cash and short-term investments. It indicates how much cash is left after subtracting loans.
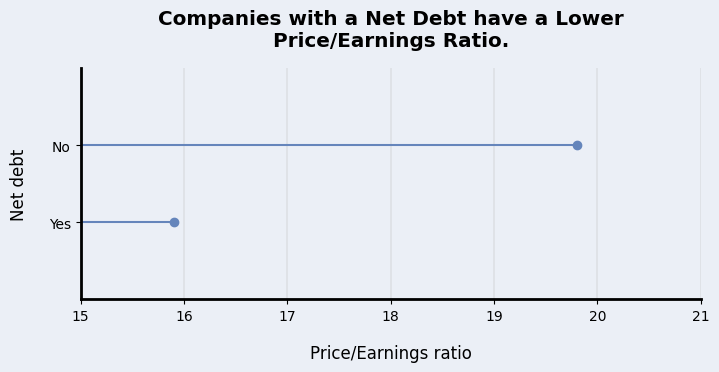
Companies with a negative net debt have cash left after paying off all loans. This group makes up 41% of the researched companies. Investors highly value them, with a median P/E ratio of 19.8, while the ‘cheap stocks’ are valued at 15.8.
Takeaway: Investors prefer companies without a net debt slightly more than companies with a net debt. Overall, it is hard to determine if investors prefer healthy balance sheets.
Estimated growth
This category gave substantial valuation differences we hoped to find in this study. Based on the results in the growth category, we selected the same figures (revenue and earnings per share) for this category.
The figures are analyst estimates for five years from now. Analysts work for investment banks and other financial institutions. They analyze the company’s financial statements and give predictions. Some companies are covered by many analysts, while others are not or are less covered.
Estimated revenue growth north of 15% per year has P/E ratios above 30. It is observed that lower yearly growth results in lower valuations by investors. Notably, 15% and more revenue decline have a higher P/E ratio than lower growth declines.
We looked at these individual companies. And most of them are active in the ‘Oil, gas, and consumer fuels’ industry. During recent years, they had phenomenal returns and still have high valuations. Analysts expect the revenue to return to normal, which means a decline, but short-term investors still value it highly.
The EPS is a popular metric among investors. Here, we see a yearly future estimated EPS growth of 20% or more with a P/E of 32.6! The shape of the total curve is to be expected. The higher the annual future EPS growth, the more investors will pay handsomely.
Should you pay much attention to estimates from analysts? We are not here to advise you on that. But the economy is complex, and we don’t know which groceries we will buy next week. Let alone that they can predict consumer spending five years in the future.
Takeaway: A positive correlation appears between the future EPS growth and P/E. A similar pattern emerges for the estimated revenue growth. However, the pattern has an exception from high-valued companies with out-of-norm revenue.
Valuation by market capitalization
Investors divide companies based on market capitalization. In this study, we look at only four categories: Small, Mid, Large, and Mega-cap. The table below shows the number of companies per group and the corresponding price/earnings ratio. We added a column to indicate the market cap range per category.
| Category | Valuation range | Companies | P/E ratio |
|---|---|---|---|
| Mega-cap | >$200 billion | 47 | 28.8 |
| Large-cap | $10 billion - $200 billion |
1189 | 18.6 |
| Mid-cap | $2 billion - $10 billion |
2520 | 27.8 |
| Small-cap |
$300 million - $2 billion |
5162 | 17 |
At first glance, it is clear that the Mega cap has a 10-point higher P/E ratio than the other groups. What causes the difference?
There are a couple of reasons for this, and give a brief explanation. This topic is so big, we can write another article just for this. The first is that various types of funds have restrictions from the financial authorities. They have to find big companies to invest a sizable sum while managing large sums of capital. Investing in a small-sized company does not influence the performance of a fund.
The second is called window dressing. Fund managers want to have popular companies in the portfolio for their clients. The third is that fund managers want to retain clients and thus invest in the same companies as competitors.
| Category | Valuation range | Companies | P/E ratio |
|---|---|---|---|
| Mega-cap | >$200 billion | 31 | 30 |
| Large-cap | $10 billion - $200 billion |
428 | 22.3 |
| Mid-cap | $2 billion - $10 billion |
518 | 17.3 |
| Small-cap |
$300 million - $2 billion |
510 | 12.1 |
Since Wall Street is the world’s financial hub, we looked at the effect of American companies in the data. The table above shows that the valuation gap is even wider. Individual investors like you and us have an advantage by looking for mispriced companies (cheap stocks) in the Small cap.
Takeaway: The Mega-cap has a 10-point higher P/E ratio than the other categories.
Valuation by country
Common sense dictates that some countries favor investing more than others, which usually results in higher valuations. Obviously, a country’s unstable economics or politics may attract less investing capital from foreign investors as it is difficult to make economic growth predictions.
| Country | Companies | P/E ratio | Country | Companies | P/E ratio | |||
|---|---|---|---|---|---|---|---|---|
| 1 | India | 562 | 27.4 | 21 | Bangladesh | 19 | 13.8 | |
| 2 | China | 2125 | 26.3 | 22 | Canada | 196 | 12.7 | |
| 3 | Saudi Arabia | 86 | 23.7 | 23 | Belgium | 46 | 12.2 | |
| 4 | Switzerland | 110 | 20.8 | 24 | Indonesia | 124 | 12 | |
| 5 | Denmark | 46 | 20.4 | 25 | Israel | 84 | 12 | |
| 6 | Sweden | 120 | 18.9 | 26 | South Korea | 227 | 11.8 | |
| 7 | Thailand | 135 | 17.9 | 27 | Spain | 53 | 11.5 | |
| 8 | Taiwan | 455 | 17.9 | 28 | Poland | 47 | 11 | |
| 9 | United States | 1487 | 17.2 | 29 | United Arab Emirates | 42 | 10.9 | |
| 10 | Australia | 149 | 17.1 | 30 | Brazil | 116 | 10.8 | |
| 11 | Argentina | 27 | 16.8 | 31 | Ireland | 10 | 10.8 | |
| 12 | Germany | 154 | 16.5 | 32 | Norway | 60 | 10.6 | |
| 13 | United Kingdom | 248 | 16.1 | 33 | South Africa | 65 | 10.2 | |
| 14 | The Netherlands | 38 | 16 | 34 | Philippines | 58 | 10.1 | |
| 15 | Mexico | 54 | 15.4 | 35 | Austria | 30 | 9.9 | |
| 16 | Vietnam | 58 | 15.3 | 36 | Hong Kong | 373 | 9.6 | |
| 17 | Malysia | 110 | 15.1 | 37 | Singapore | 71 | 8.9 | |
| 18 | Italy | 70 | 14.4 | 38 | Turkey | 91 | 7.6 | |
| 19 | France | 158 | 14.2 | 39 | Nigeria | 11 | 4.3 | |
| 20 | Japan | 1003 | 14 | 40 | Russia | No data | - | |
Turkey has experienced high inflation recently, hence the lower price/earnings ratio. Many foreign investors avoid the Turkish stock exchange to prevent further devaluation while investing in Turkish companies. Investors may flock to the Turkish market again to pick up cheap stocks, and the price/earnings rise when the dust settles.
India and China are at the top of the list with the highest valuations by investors. The companies in the two countries are likely overvalued. We expected the United States to be among them, but they barely make the top 10. Remember: it may differ in two years, as it is a snapshot from one moment.
Governments may make it difficult to invest in companies in foreign companies. It results in investments in domestic markets and higher valuations as investment capital can not flow elsewhere.
We are not qualified to draw any conclusions here. We lack the knowledge of every country’s situation, laws, and investment culture to interpret the price/earnings multiples.
Download the dataset
Conclusion
According to the data, investors are more likely to pay handsomely for a company’s prosperous future revenue and earnings per share growth. Estimated revenue and earnings growth showed the largest price/earnings ratio discrepancy. Other less significant differences are dividend payout, net debt, and gross profit margins (%).
Interestingly, the Mega cap has a 10-point higher valuation than other cap groups. Small investors like you and us have an advantage by investing in Small-cap stocks. Here it is more likely to find undervalued companies.
We hope you enjoyed this study. It may help you understand other investors’ valuations. Do you have questions, suggestions, or remarks? Feel free to reach out to us in the comment section or contact us.
