What is price to earnings (P/E) ratio?
The price-to-earnings ratio is often called the P/E ratio or price-earnings ratio. It is a financial indicator for valuing a company’s price per share relative to its earnings per share (EPS). The ratio indicates how many years you have to be a (partial) business owner of the company, where earnings per share stayed the same for the same number of years, to get the investment back. A P/E ratio of 12 takes also 12 years to get the investment back.
During the years, the company’s earnings are more likely to go up or down than to stay the same. The direct impact is that it will take shorter to get the investment back when the earnings steadily grow over time. While it will take longer when the earnings go down.
The P/E ratio alone is not a good metric to analyze a business. But it indicates a company’s under- or overvaluation. The ratio makes competitors comparable within an industry.
How to use the P/E ratio calculator?
The P/E ratio calculator is a tool for calculating the ratio between the price per share and the earnings per share. It indicates when a company might be under- or overvaluation.
The P/E ratio calculator has two variables: price per share and earnings per share. Both the diluted and basic EPS are accepted. The EPS is found in two ways and is explained in the next chapter. Further, the tool automatically calculates and shows the result on the screen.
How to calculate the P/E ratio?
The formula is as follows:
P/E \> ratio = \frac{P_{share}}{EPS}
Where:
P_{share} = the price per share.
EPS = basic or diluted earnings per share.
The price per share is easy to find through a stock screener. Type in the company, and the price is immediately displayed. The earnings per share is retrieved in two ways. Most companies calculate this figure for you on their income statement. When it is not given, use the formula below to calculate it yourself:
EPS = \frac{NI}{S_{avg,outstaning}}
Where:
NI = net income.
S_{avg,outstanding} = basic or diluted average shares outstanding.
Both the net income and the outstanding shares are stated on the income statement. Outstanding shares are divided into a basic and diluted number of shares. The basic figure is the actual outstanding shares at the moment. While the diluted number of shares takes future added shares into account. For example, known stock options are added, because they will take a part of the net income. This is why using diluted shares is preferred.
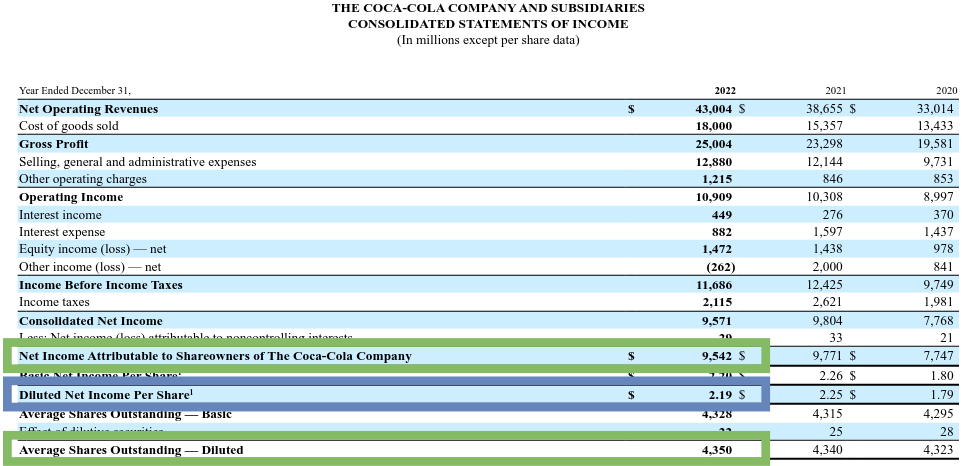
Observe Coca-cola’s (KO) income statement. The blue colored box highlights the diluted earnings for the financial year 2022. The green boxes highlight the net income and the diluted average shares outstanding for the same period. Filling in the figures for the EPS formula, we get $2.20. This is slightly off with the diluted EPS figure in the blue box. Note that the figures are in millions, which can cause a minimal offset.
Coca-cola’s share price at the end of this period was $63.61. Now we can calculate the price-earnings ratio too:
P/E ratio = \frac{63.61}{2.19} = 29
The difference between trailing P/E ratio and forward P/E ratio.
In the previous Coca-cola example, we used the EPS of the last twelve months (LTM). This is often referred to as the trailing P/E ratio. However, companies are valued on performance in the future. So, the trailing P/E ratio is treated as an indicator.
To compensate for past earnings, some investors like to use expected future earnings. The forward P/E ratio uses the predicted earnings by market analysts. The predicted earnings period is over the next twelve months (NTM). The managers may bring out projections on revenue, net income, and more for the upcoming year. Another way of getting future estimates is the use of extrapolating historical earnings.
In this example, we look again at Coca-cola. Market analysts expect the earnings at the end of 2023 to be at $2.35. The current price (25 Juli 2023) is $62.46., which results in a forward P/E of 26.6.
In conclusion, the trailing P/E ratio is based on past performance. Where forward price to earnings bases the earnings on predicted income for the future.
What is a good P/E ratio?
A good price-earnings ratio is very subjective. Historically, a rule of thumb is a P/E ratio of 15 is decent. Everything above means it is overvalued and below 15 means an undervaluation of the company.
Note
A company with a ratio below 15 has likely underlying problems, like reducing net income, customer decline, etc. Events like this can be temporary or permanent. Temporarily events are great moments to take advantage of the situation and get in on a lower multiple.
Look at the S&P 500 90 historical P/E ratio. It is an average of the 500 company’s P/E in the S&P. The last 30 years have had higher ratios, which means plenty of companies are overvalued. The mean of the historical price-earnings ratio is 17.5 and the median, green line, is 16.7. With the many outliers to the upside, the median is a better figure.
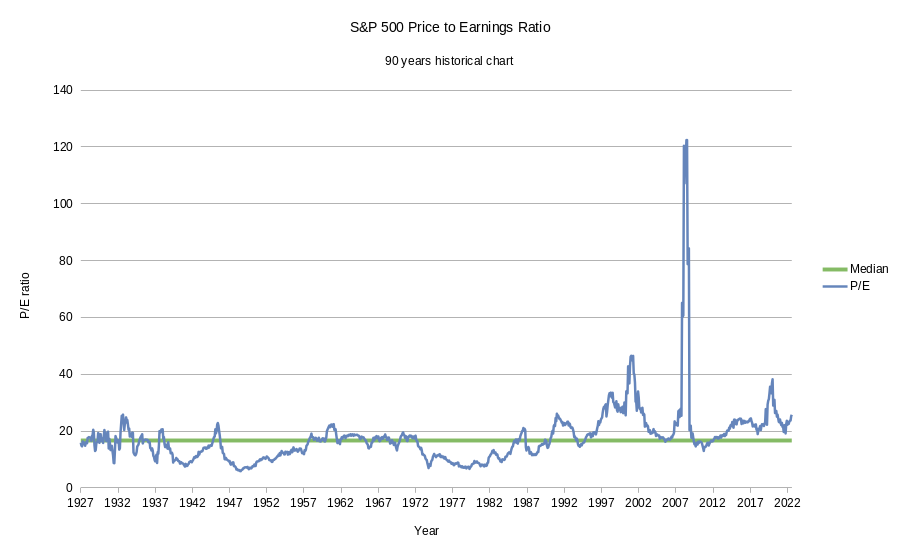
Looking at the current average P/E ratio of the S&P and the median, the market looks overvalued. As it is the median, it means that some sectors have lower multiples and others have way higher ones. Banks have a P/E of around 10. Growth stocks, on the other hand, are known for high price-earnings ratios.
Growth stocks
Growth stocks have high price-to-earnings ratios because of the expected earnings growth in the coming years. And companies get valued based on future expectations. When a growth stock has a ratio of 30, it is expected that the earnings double in a few years. The rapid increase in earnings means that you get your investment back earlier than the initial 30 years.
Growth investors pay usually 30 to 40 times earnings. The technology sector is notorious for high P/E ratios. They can go up to 100 times. In the case of Nvidia (NVDA), it is at 230 times earnings because of the current AI craze in 2023.
Cyclical stocks
Cyclical industries like car manufacturers don’t have steady earnings year over year. The pattern is a couple of years with substantial profits followed by several years of marginal gains or even losses.
The P/E ratio at the end of the low cycle characteristically increases rapidly. And at the end of the high cycle, the ratio goes down while the earnings are still decent. Don’t get yourself fooled by situations like this. Other figures indicate the downturn of cyclical companies.
The Shiller P/E ratio is a better indicator for cyclical stocks. It takes the average over a longer period (longer than 1 cycle) and adjusts for inflation.
Stalwarts
Companies past their initial growth phase are going to a maturity phase. Here the price-to-earnings ratio is getting lower, as investors don’t want to overpay for lower earnings growth. The stock price fluctuates throughout the year, which creates windows of opportunities to get in lower. Coca-cola has a ratio of 27.5 a the time of writing, which is still very high. Less popular companies have ratios between 15 and 20.
>> Learn more: Why are some Stocks Cheap and other Expensive? (2023 Study)
What if the P/E ratio is negative?
A negative price-earnings ratio happens when the net income of the company is at a loss. Stock screeners indicate a negative ratio with a dash, “N/A” or display the negative multiple.
What are the drawbacks of the P/E ratio?
A company’s value is based on future earnings. The trailing P/E ratio is based on past earnings. The forward P/E compensates for it, but the earnings are just estimates. It is not a guarantee for accurate results.
Besides, the EPS is the net income of the company and it is known that managers make the income statement look better than it is. Investors get different results with different accounting methods. This makes it harder to use the ratio to compare individual companies together.
Price Earnings Growth (PEG) ratio
The P/E ratio doesn’t take the growth of the company into account. The PEG ratio, popularized by Peter Lynch, does exactly this. The ratio divides the P/E by the growth of the company:
PEG = \frac{P_{share}/EPS}{G}
Where:
G = growth of the company
The company’s growth is expressed in several ways: net income, free cash flow, or revenue. You can decide which one to take for growth measurement. Keep in mind, that it is also based on the type of company and in what phase the company is. A PEG ratio below 1 indicates undervaluation. Above 1 indicates overvaluation as the P/E is higher than the company’s growth.
EV/EBIT ratio
The EV/EBIT is the enterprise value divided by earnings before interest and taxes. This ratio is a similar metric to the price-to-earnings ratio. It also indicates under- and overvaluation, but this ratio makes up for some shortcomings of the P/E:
EV/EBIT = \frac{EV}{EBIT}
Where:
EV = market capitalization + total debt – cash & cash equivalents.
EBIT = earnings before interest and taxes.
This ratio praises businesses with a healthy balance sheet and penalizes the ones with a bad balance sheet. It also includes deprecation and amortization, which is useful for capital-intensive businesses like steel manufacturers and the oil industry.
