
Levered and unlevered free cash flow indicates the financial health of the company. Find out how profitable companies are. Is there room for growth or are they buried in mountains of debt? This article dives into the free cash flow of companies. Here is what you should know about free cash flow as an investor.
What is Free Cash Flow?
The free cash flow (FCF) is a method for investors to measure the company’s performance. The metric can be derived from the cash flow statement. Subtract investment activities such as Property, Plant & Equipment (PP&E) from the cash flow of operating activities to come at the free cash flow of a company. The free cash flow gives an idea of how much cash is left for the growth of the business or to return to shareholders.
Some investors prefer free cash flow over net income when it comes to analyzing a business. The reason is that net income is easier to manipulate than FCF. Compensation for managers and the CEO is often tied to the company’s income figures. Add to this fact that Wall Street presses companies on ever-increasing earnings, which makes some managers prone to do ‘flexible accounting’.
Inflating revenue, selling assets for a one-time gain, or moving current expenses to an earlier quarter, or a later date. These are some examples and unfortunately for investors, there are more ways to move the figures around in the income statement.
A counterargument for using FCF in company analysis is that the free cash flow fluctuates more frequently than the net income. Which makes it more difficult to work with, especially for beginning investors. The one-time capital expenditures (CapEx) are large sums of money but have a long-term influence on the business. Investments like this reduce the free cash flow significantly year over year.
FCF is the cash flow from operating activities minus capital expenditures. Some investors prefer to subtract all the cash flow from investing activities instead of only the capital expenditures. And even not the total CapEx has to be subtracted. CapEx is made up of growth expenditures and maintenance expenditures. Neither GAAP nor IFRS accounting standards require informing investors of the amount for maintenance. This leaves managers room to manipulate the metrics a bit.
Some companies report maintenance expenditures in the managers’ discussions/notes in the financial statements. But more often they do not. Investors can do here two things: one, use the total CapEx figure, or two, estimate the portion for growth and the portion for maintenance. For conservative calculations, use the total figure. It increases the margin of safety in your analysis.
CapEx = growth\>expenditures + maintenance\>expenditures
There are, in fact, two types of free cash flow, each with there own purpose:
Levered free cash flow, more known as free cash flow to equity (FCFE).
Unlevered free cash flow also referred to as free cash flow to firm (FCFF).
What is Unlevered Free Cash Flow?
Unlevered free cash flow (UFCF) is the cash flow available to all its shareholders and debt holders. Paying debt holders get priority because most debt payments are mandatory. Missing a payment before its due date means bankruptcy for the company.
UFCF is an interesting metric to understand the company’s ability to expand. Expanding one’s business is done through a bigger market share, new products or services, and tapping into new markets. UFCF is also the base for determining the intrinsic value of the company and is widely used in discounted cash flow analysis. The value investor Warren Buffett states it as follows in his owners manual published in 1999:
"Intrinsic value can be defined simply: It is the discounted value of the cash that can be taken out of a business during its remaining life."
Warren Buffett
Let’s take a look at how the UFCF is calculated. First, subtract the change in working capital, capital expenditures, and interest minus taxes from the net income. The second step is adding deprecation & amortization to the figure. The formula looks then as follows:
UFCF = NI \>-\> \Delta WC_{net}\>–\>(INT * (1 \>– \>TR)\> – \>CapEx + DA
Where:
NI = net income
DA = deprecation & amortization
INT = interest expense
TR = tax rate
CapEx = capital expenditures
\Delta WC_{net} = change in working capital
It’s basic math and understandable for everyone. The difficult part may be to find the figures in the financial statements. So, let’s walk you through this.
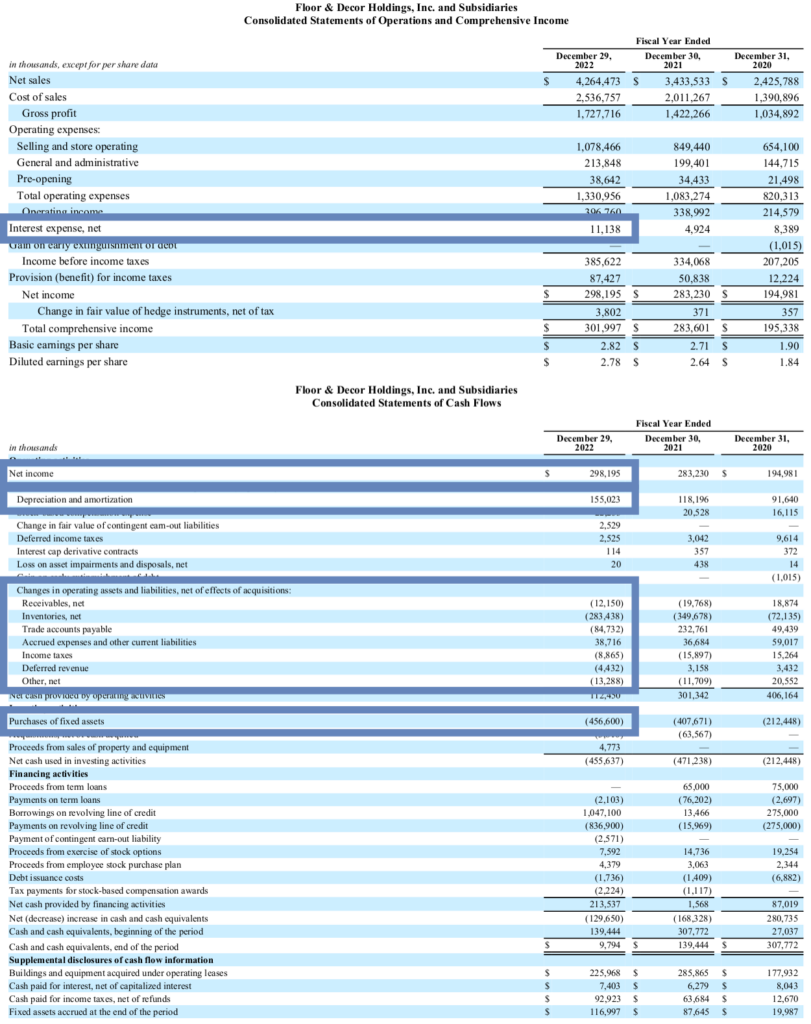
The American company Floor & Decor Holdings (FND) is used in this example. The figure above consists of the income statement and cash flow statement from the annual report of financial year 2022. The variables from the formula are highlighted in the blue boxes.
All variables can be found on the cash flow statement, except for the tax rate and net interest expense, which are on the income statement. The tax rate is not known, so take the maximum of 30% for a margin of safety in your analysis. The net income is found in both statements, as the statements are linked to one another this way. The deprecation & amortization is easy to find too, as it is written out under the net income.
The change in working capital is the change of assets and liabilities on the balance sheet. FND gives investors more clarity as to which assets and liabilities it applies, categorized under ‘Changes in operating assets and liabilities’. The sum of the changes in assets and liabilities is the change in working capital.
Floor & Decor Holdings has a negative unlevered free cash flow, when all variable are put into the formula:
UFCF = \$298,195\> – \>\$368,189\> – \>(\$11,138 * (1\>-\>0.3))\> -\> \$456,600 + \$155,023 = -\$388,367
Limitations of UFCF.
UFCF ignores the capital structure of the company. It makes it easier for investors to compare businesses from the same industry. The owner or its managers can put, in theory, every capital structure in place. It is in practice more limited to what is possible. A company with debt has to pay interest and this is excluded from the unlevered free cash flow metric.
UFCF can be manipulated by the managers of the company. Laying off employees, delaying capital projects, liquidating inventory, and delaying payment to suppliers are some of the methods to ‘improve’ the figure. Investors should be cautious and check if these actions are beneficial for the company’s long-term strategy.
What is Levered Free Cash Flow?
Levered free cash flow (LFCF) is the cash that is left after the company has paid its financial obligations. The metric tells investors how much cash can be returned to the shareholders through dividends and share buy-backs. Another way is to invest the money for the company’s future growth. Shareholders see the effects of such investments after a longer period.
LFCF may also be an indicator of the company’s ability to secure additional capital through financing. The metric signals that the company can pay the interest on borrowed capital.
The formula for levered free cash flow is as follows:
LFCF = CFO \>– \>CapEx \>– \>D_{net\>issued}
Where:
CFO = cash flow from operating activities
D_{net\>issued} = issued debt – proceeds from debt
The variables are found on the cash flow statement. The net debt issued is the issued debt minus the proceeds or payment from the debt. Issued debt is included, because companies use debt to pay out dividends, repurchase shares, or both.
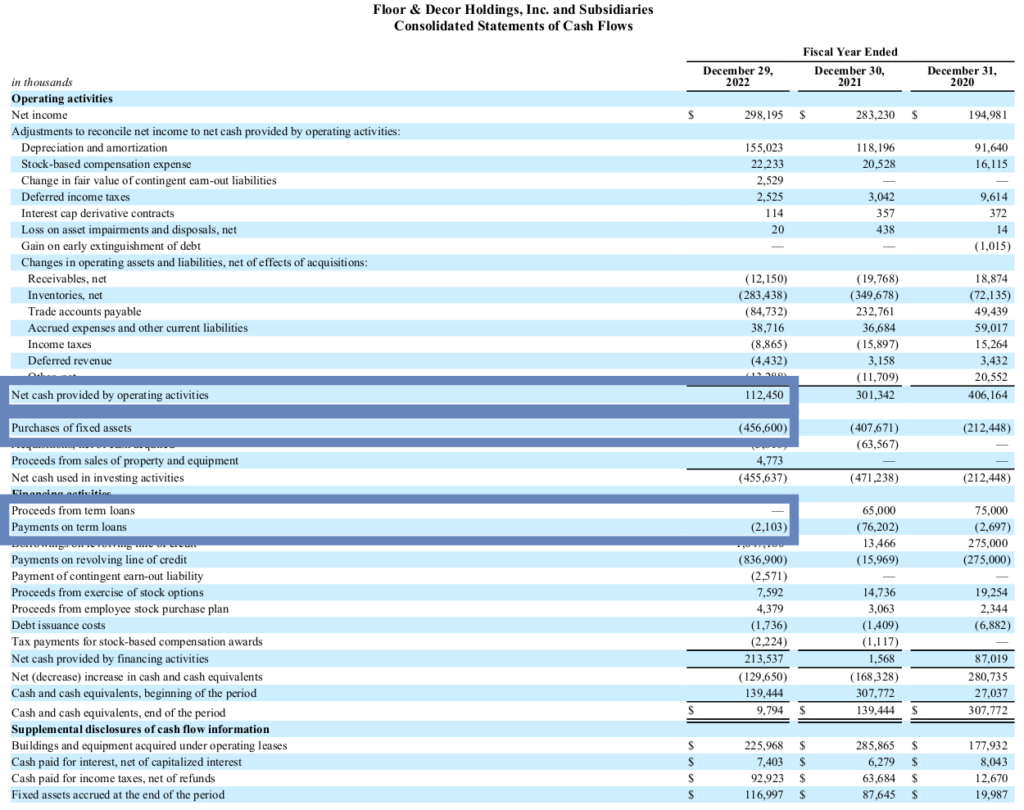
Take a look at the cash flow statement of Floor & Decor Holdings again. The variables are highlighted in blue boxes. FND did not take on more debt through 2022 but paid off $ 2.1 million. Filling in the numbers in the formula results in a negative levered free cash flow of -$346,253.
The LFCF is negative for FND, but it does not mean perse that the business is failing. One has to look closer to be the judge of this. In the case of FND, it is growing and adding stores to its portfolio at a high pace. It made sizable investments, which take time to pay off.
What is the difference between levered and unlevered free cash flow?
The difference between the free cash flow metrics is how they treat debt. FCF includes interest expenses and excludes debt payments. Whereas UFCF excludes both interest expenses and debt payments. In contrast, LFCF includes both interest expenses and debt payments.
Unlevered free cash flow is mainly popular by investors, investment banks, and potential buyers. The metrics tell how much money can be subtracted from the business when no new investments for growth are made. It is the base for determining its intrinsic value.
Levered free cash flow is used by bankers when they decide the risk of loaning money to the company. The metric indicates how much cash the company has to return capital to shareholders or get additional financing for growing the company. It is a measure of potential growth, profit, and sustainability.
Bottom line
In summary, both levered free cash flow (LFCF) and unlevered free cash flow (UFCF) are useful figures for determining the company’s performance. Unlevered FCF, also known as a free cash flow to firm (FCFF), indicates how much generated cash can be subtracted from the business. Which is the base for calculating the intrinsic value. Investors, potential buyers, and investment bankers mainly use this figure to determine the company’s growth potential.
Whereas LFCF, also referred to as free cash flow to equity (FCFE), tells how much cash can be returned to its shareholders without hurting the operations of the business. Loan providers such as banks use this metric to determine their ability to pay off more debt when the company requires this.
Frequently Asked Questions (FAQ)
