
Are you starting with investing, and the complexity of fundamental analysis is overwhelming? Stock Rover might be the ultimate platform for you. This in-depth Stock Rover review addresses every feature on its platform.
Highlights
Stock Rover is a platform rich in portfolio and research tools for beginning investors. The tools are Monte Carlo simulations, correlations, future projected income, and rebalancing. These portfolio features are more than most competing platforms have to offer. Find American and Canadian stocks with the stock screener.
Stock Rover is ideal for beginning investors. The research reports helps you understand what figures to look for in fundamental analysis.
Price
($0 – $27.99/mo)
Simplicity
Features
Likes
- Portfolio performance with benchmarks
- 650+ screening metrics
- Broker integration
- Stock correlations
Dislikes
- Steep learning curve
- Limited market data
Stock Rover Review
Stock Rover is a platform created by two investors. Both with a software development background, they aimed for a platform that is more than a stock screener alone. The goal is simplicity, improving how investors perform research and tracking investments.
It started with many spreadsheets and multiple sources for their stock research. After many frustrations, they decided to build a platform together. It must be so good that they would love to use it themselves. Then, they liked to share the platform with you, the investors. An actual creation for individual investors by individual investors.
Stock Rover features
The Stock Rover platform has tools for analyzing your portfolio and stock market research tools. The tools are oriented towards growth, dividend, and value investors but may initially seem overwhelming. You know what investment strategy you apply, so you don’t need to familiarize yourself with the other tools.
After logging in, the screen has a navigation bar for various tools on the left and displays the dashboard. The categories Today’s Market, My Collections, Portfolio Tools, and Research Tools are in the navigation bar.
Today's Market
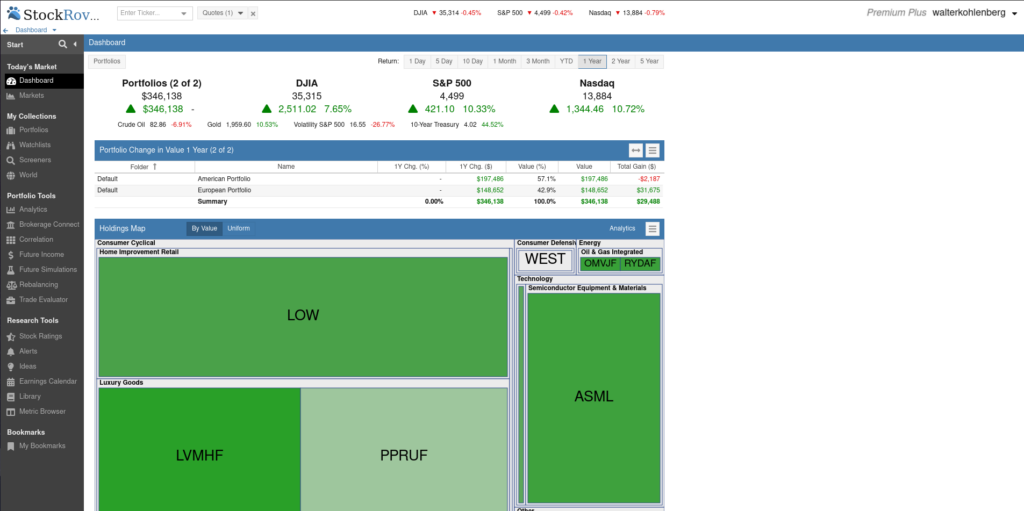
The category ‘Today’s Market’ consists of a dashboard and markets. The dashboard displays a performance summary of your portfolio(s). This summary includes the gains/losses of individual stocks and the performance of American indices over a selected timeframe.
A holdings map indicates the sector and the size of every investment in the portfolio. The dashboard also provides a chart to track the portfolio performance against a self-selected benchmark.
Further, the dashboard contains information on the market through market movers, sector performance, 52-week highs/lows, and the earnings calendar. The user may rearrange the order of the markets’ and portfolios’ presentation.
The market section shows a summary of the American financial markets. And it allows you to dive deeper into stocks, ETFs, bonds, and commodities. Each of these segments has financial market news. Customize the news feed to your needs with many sources like Wall Street Journal, Zacks, Google News, Forbes, and investing.com.
My Collections
The category ‘My collections’ has four sections: portfolios, watchlists, screeners, and world. It entails what stocks and information the user prefers to follow.
Portfolios
The portfolio screen has an extra navigation bar dedicated to all portfolio features. The middle screen shows the selected portfolio and chart for individual stocks. The right side panel contains insights for the company. Here you will find the research report, financial statements, and more.
The portfolio navigation bar contains a list of your saved portfolios. Here you can create and modify them. Further, it has many options for portfolio analysis. The analytics tools are described here in the Stock Rover review.
The selected portfolio has every investment displayed in a table, prominently in the middle of the screen. The table comes with default data columns. These are scores for valuation, growth, sentiment, and more. The scores range from zero (worst) to 100 (best). Do you wish to see other metrics? Modify the columns to your choosing. The Premium Plus Plan has up to 650 metrics, including price/tangible book and free cash flow.
Under the table, a chart visualizes the stock price. It has options to include a benchmark or another stock for comparison. The benchmarks you can choose are indices, sectors, industries, commodities, and portfolios.
Watchlists
The section ‘Watchlists’ has an identical layout and almost the same functionality as ‘Portfolios’. The watchlist actions in the navigation bar don’t have analytics tools like the portfolio section. Watchlists have the purpose of keeping track of potential investments. Set alerts for updates on the company’s metrics improvements or price changes.
Screeners
The Stock Rover stock screener has the same layout as described above. The left pane is for creating, modifying, and navigating through saved screeners. The center of the screen displays the results after filtering through the American and Canadian publicly traded companies.
Create a new stock screener in only a few steps. First, select stocks, ETFs, or preferred. Second, decide the number of companies you want to look through based on market capitalization and country. And third, add criteria that include more than 500 metrics in the Premium Plus plan. The many categories of metrics go from analyst estimates to sector deciles and from fari value & DCF model to valuation yields. It is too much to name all!
World
The ‘World’ Section has information and insights on individual stocks. The stocks are categorized by indices and by sector or look up individual quotes. Further, there is a list of commodities and many ETFs to analyze.
Portfolio Tools
The category ‘Portfolio Tools’, as the name suggests, includes tools for portfolio analysis. Earlier, we addressed the creation of portfolios. From that page, it is possible to use the tools too. Let’s discuss the useful tools step by step.
Analytics
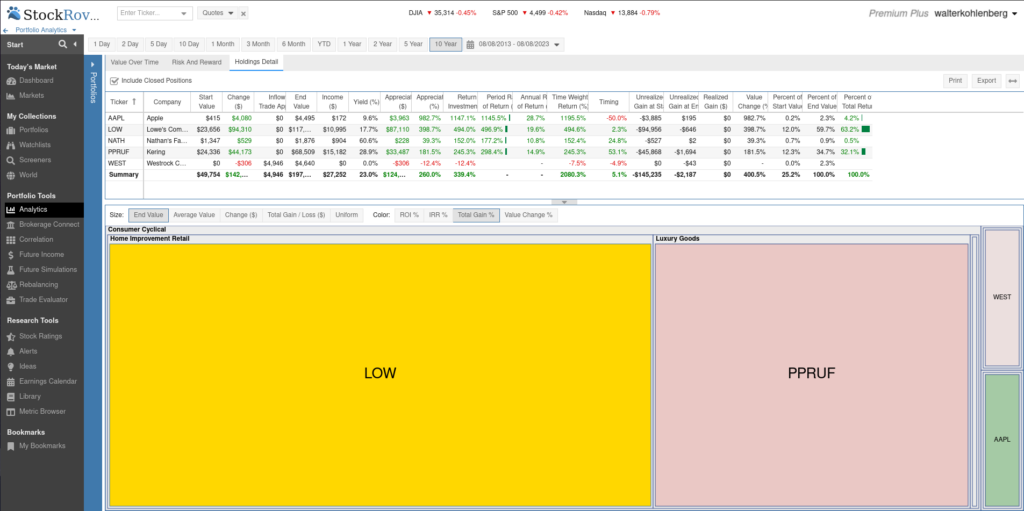
The ‘Analytics’ section gives insights into the performance of your portfolios. Select a timeframe (i.e., 1 month, YTD, or 10 years) and visualize the price development against your chosen benchmark. Another option is to analyze the risk and rewards of the portfolio. With metrics such as beta, volatility, and Sharpe ratio, the program tries to define risk for your portfolio.
Brokerage Connect
The Stock Rover platform has the option to connect to your stock broker. The goal is to synchronize the portfolio, its changes, and transactions with Stock Rover. It’s one of the conveniences the platform has to offer. When connected, you never have to create and update another portfolio by hand.
Link well-known stock brokers such as TD Ameritrade or Vanguard to Stock Rover. Mind you that the platform orientates at investors interested in American and Canadian markets. Thus, only some brokers from Europe may connect.
Correlation
As the name suggests, this tool helps you understand the correlations between individual stocks, portfolios, and watchlists. The correlation bases itself on daily returns over a chosen interval, for example, one year. Again the time interval may be 1 day, 3 months, years, or a custom one.
Future Income
Many companies pay out a dividend. Dividend investors like to know precisely when and how much they get. The ‘Future Income’ tools show this information and thus a must-have for you, dividend investors.
The future projected income displays the dividend income in three ways. The summary tab shows the income per quarter and year in a table and a chart. The portfolio level tab shows the income per month per portfolio. And holding level tab is the most extensive and indicates even the dividend per company.
Future Simulations
‘Future Simulations’ is a Monte Carlo simulator. It estimates the future portfolio performance based on past performance. Select a sampling period, estimated inflation, and more for extensive simulations. Extra options for rebalancing the portfolio over time and making cash deposits or withdrawals are possible to simulate the behavior of future portfolio change as accurately as possible. The results of the simulations are visualized in two charts and a summary table.
Rebalancing
Find out the effect on your portfolio when you make hypothetical investment changes. This page gives insight into these changes.
The analytics tab includes differences in historical returns and returns vs. S&P500. Here, you can select a timeframe ranging from 1 day to 10 years or set a custom period. The metrics tab shows the difference in dividends, P/E ratio, price/book value, and earnings growth expectations. The other two tabs visualize the sector allocation in a table and pie chart.
Trade Evaluator
The ‘Trade Evaluator’ displays the trades from your portfolio in a table. Compare the gains/losses with a chosen benchmark. Further, it includes fees, dividends, dollar and percentage returns, and more. This tool only works when you connect to a stock broker or add all trades you made by hand.
Research Tools
The Research Tools focus on finding and analyzing potential investments. The section ‘Earnings Calendar’ displays the earnings release date of companies from your portfolios, your watchlists, or every public company on the Northern American continent. Follow the portfolios of value investors like Seth Klarman and Warren Buffett in the ‘Library’ section. Another section called ‘Ideas’, generates investment ideas through lists of outperforming stocks and weekly investment articles.
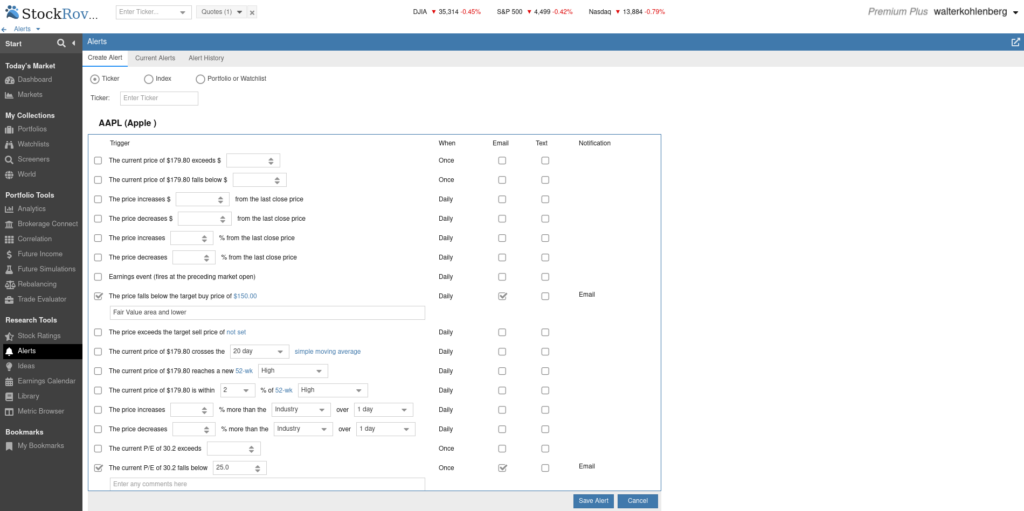
Set alarms in the extensive ‘Alert’ section. You create and modify alarms for tickers, indices, and portfolios/watchlists here. Many triggers (i.e., p/e, current price, and dividends) are available. And for every trigger, you receive a notification per email, text, or both.
Stock Rating
The ‘Stock Rating’ section attempts to assign a rating to individual stocks based on comparing other stocks in the same industry. The rating divides into the tabs Profile, Growth, Valuation, Efficiency, Financial Strength, Dividends, and Momentum.
The profile tab summarizes the ratings from the other tabs. Besides, it tells some general statistics, like market capitalization, employees, and institutional ownership of stocks. It also describes the company’s products or services.
The other tabs try to visualize growth, valuation, and financial strength more accurately. Use the ratings and analysis as an indication. For example, if some are growth companies and others are not, then the growth analysis is invalid. Stock ratings are a tool, you can use it, but you still have to think for yourself.
Research Reports
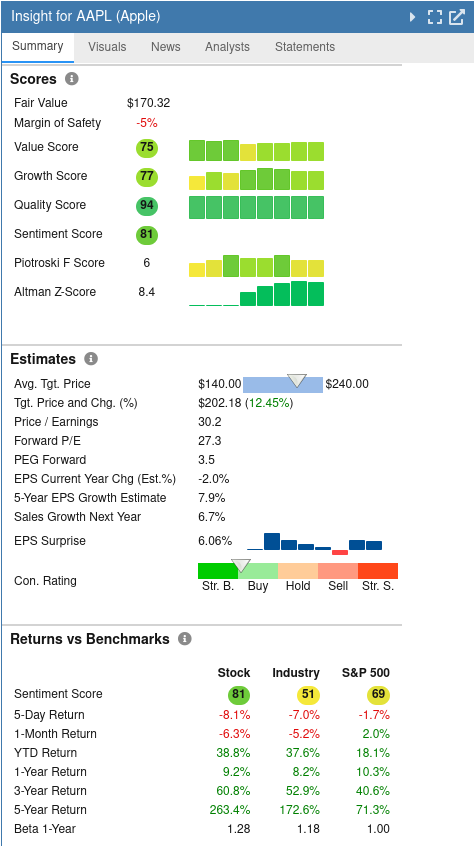
The ‘Research Reports’ in the insight panel provides comprehensive investment analysis for +7000 American Stocks. The report is divided into 15 segments: profile, scores, analyst estimates, returns vs. benchmarks, valuation, growth, financial health, and profitability. You can read the full report on the platform or save it conveniently as a PDF file.
Note
The PDF makes data in tables visible in charts, whereas the research reports on the platform come only with tables.
Every segment dives deeper. For example, the profitability segment looks at gross margin, operating margin, net margin, return on assets, return on invested capital, and return on equity. These metrics are compared to the industry and the S&P 500.
Pricing Options
At the moment, Stock Rover offers four plans. Essentials, Premium, and Premium Plus are affordable-priced plans. The fourth one is free and comes with minimal usage to get to know the platform. The research reports plan is an addition to the free and paid plans.
Research reports are an extra feature outside any plan. You can purchase it for $99.99/year or pay $49.99/year for annual subscribers.
The features Stock Rover has to offer are ideal for dividend investors and beginning investors who need more help with the interpretation of the financial figures.
Free Plan
The free plan comes with ads and little functionality. Only the dashboard, markets, portfolio/watchlists, ideas, and earnings calendar are accessible. The stock screener is not available; however, you can analyze the company with its financial statements. You need to know the ticker of the company to find this information.
Essentials Plan
The Essentials Plan is $7.99/month, $79.99/year, or $139.99/2 years. This plan allows you to use the stock screener with 200 metrics, charts, portfolio management, and alerts without ads. Historical data (i.e., statements, price, and fundamentals) is available only five years back.
There are also limitations on saving stock screeners, portfolios, and watchlists. It is 15, 10, and 10, respectively.
Premium Plan
The Premium Plan comes with much more functionality. You can purchase it for $17.99/month, $179.99/year, or $319.99/2 years. The functionality of the stock screener doesn’t change, but now you can filter with up to 300 metrics. Screening on historical data is still not possible with this plan. But you can look into the company’s financial history to 10 years ago.
The charting price is extended; it now includes hundreds of fundamental metrics such as P/E ratio, gross margin, price/book, etc.
The Premium Plan unlocks every portfolio tool, hence the much more functionality. The future income tool is great for dividend investors who pursue passive income. The maximum number of saved stock screeners, portfolios, and watchlists increases to 25.
Premium Plus Plan
Purchase the Premium Plus Plan for $27.99/month, $279.99/year, or $479.99/2 years. It comes with full functionality. The stock screener can filter historical data, ETFs, and mutual funds and use up to 500 metrics. Filtering on historical data is a must for every dividend and value investor.
The Premium Plus Plan comes with extra charting options for valuation and ratios. Plot its current valuation against historical valuations and its competitors.
The maximum number of saved screeners, portfolios, and watchlists increases to 60. A portfolio or watchlist can contain a maximum of 600 tickers.
Who is Stock Rover for?
Stock Rover limits the available stocks to America and Canada. Thus it is only for investors who want to invest in these two countries.
Further, Stock Rover’s focus is making financial data understandable by using scores and charts in reports. This targets beginning investors who just started analyzing companies based on fundamentals. It is ideal for investors who like tools over plain data.
It is not for investors with an advanced understanding of fundamental analysis.
Likes
Stock Rover has stock broker integration for importing portfolios, changes, and transactions. This integration spares one the tedious task of copying everything by hand.
The portfolio tools are extensive. A favorite is adding a benchmark to the chart for portfolio performance analysis. Everyone dreams of beating an index, like the S&P500, year over year. Its features are a great way to keep track of that.
Another helpful tool is the stock correlation identifier. When one wants to diversify a portfolio, this tool comes in handy. Here you identify correlations or contradicting stock returns in portfolios or individual stocks.
Dislikes
The financial statements are hidden on the platform. It is present in the navigating sidebar.
The stocks available are limited. Analyzing only companies in America and Canada is not practical for value investors. Many investors are active in these countries, while Europe or other continents are less crowded. The absence of investors creates excellent opportunities.
Further, the learning curve on the platform is steep. When you sign up, you get two weeks trial of the Premium Plus Plan. Some pages look overwhelming from the start and need to be more logically constructed. Some of these pages have plenty of information squeezed in on the screen. In contrast, other pages look almost empty.
Bottom line
In summary, this Stock Rover review concludes that it is more than a stock screener alone. It tries to make fundamental data easier to analyze, especially for beginning investors. Scores in categories such as valuation and growth help this group of investors compare companies. However, the stock screener has over 600 metrics to filter American and Canadian stocks.
The research reports are a great addition for beginning investors to understand what to look for. The summary and visualizations of figures make fundamental analysis more manageable.
The portfolio tools are more than displaying performance over time. It has tools for Monte Carlo simulations, correlations, future projected income, and rebalancing. These portfolio features are more than most competing platforms have to offer.
Frequently Asked Questions (FAQ)
